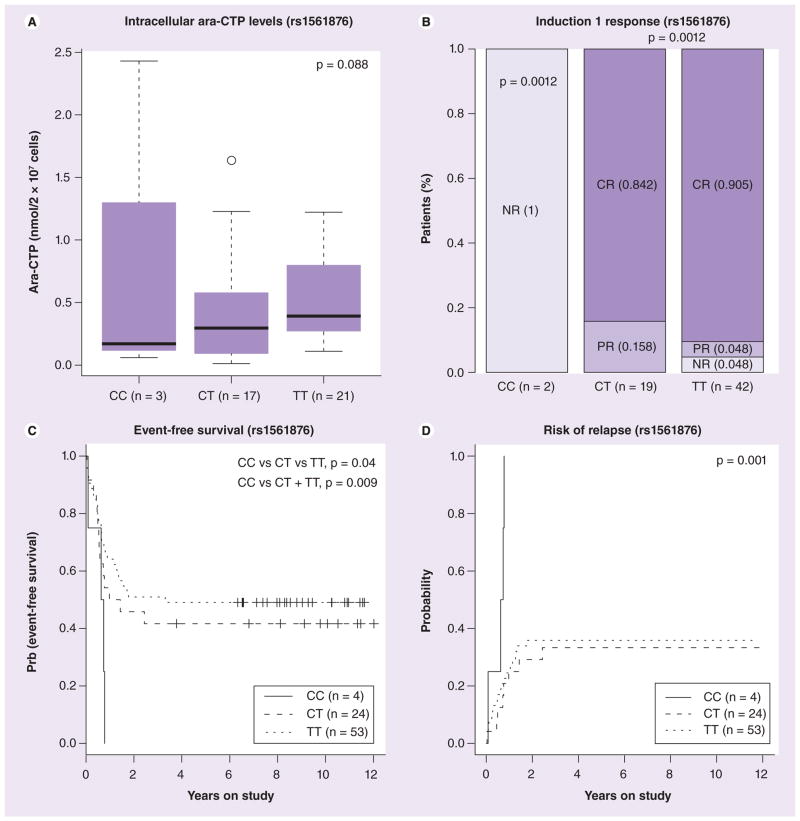
Figure 8. Association of RRM1 SNP rs1561876 with clinical outcome in AML97 patients.
(A) Box plot representing association of rs1561876 with intracellular levels of ara-CTP (nmol/2 × 107 cells) determined at day 1. Plots show medians as a line between boxes representing the first and third quartiles; the whiskers represent the range after excluding the outliers. The outliers are defined as data points that fall outside of the first and third quartiles by more than 1.5-times the interquartile range. The circle falling outside the whiskers represents an outlier. (B) Association of rs1561876 with response after induction 1 in acute myeloid leukemia (AML) patients. Percentages of patients in each category are indicated in parenthesis. (C) Survival curve for association of rs1561876 with event-free survival in all AML patients. (D) Survival curve for association of rs1561876 with risk of relapse in AML patients.
Ara-CTP: 1-β-D-arabinofuranosyl-CTP; CR: Complete response; NR: No response; PR: Partial response.

