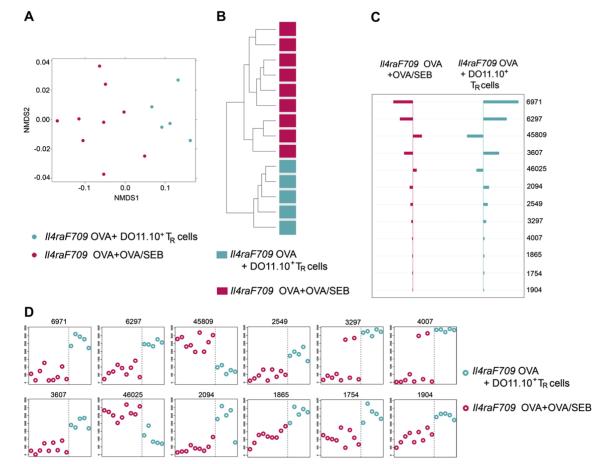
FIG 5.
Enforced tolerance with allergen-specific Treg cells resets the microbiota of allergen-sensitized Il4raF709 mice. A, NMDS based on weighted UniFrac distance between samples of OVA- and OVA/SEB-sensitized mice (n = 9) versus those of Treg cell–treated, OVA-sensitized mice (n = 5) based on the 627 taxa with significantly different abundance between groups (sham versus allergen sensitized) by using the KW test. B, Hierarchical clustering (average linkage) based on weighted UniFrac distance between samples given abundance of 627 taxa with significant abundance differences across at least 1 of the categories. C, Nearest shrunken centroid analysis of OTUs that best characterize the difference between allergensensitized versus tolerant groups. D, Representation of the abundance of the OTUs identified by the nearest shrunken centroid analysis using the PAM method.

