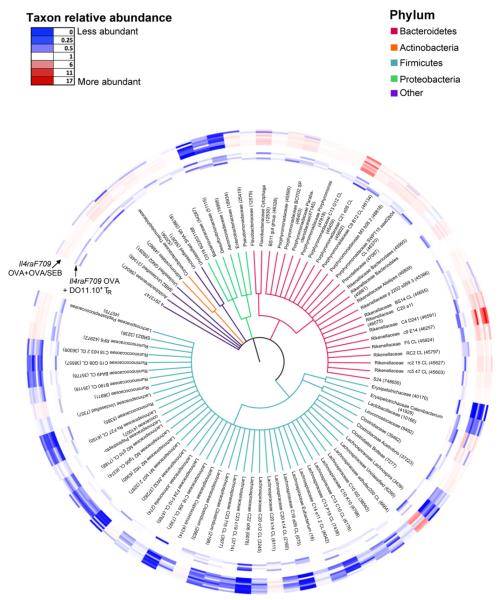
FIG 6.
Phylogenetic tree based on 16S rDNA gene sequences of bacterial families with taxa showing significantly different abundances between allergen (OVA+OVA/SEB)-sensitized Il4raF709 mice and Treg cell-treated OVA-sensitized Il4raF709 mice shown in Fig 5. KW analysis identified 627 OTUs within 78 families that have significantly different abundance between the comparison groups. One OTU with the greatest difference between the 2 group means from each family was selected. For the 8 families that contained OTUs with both higher and lower abundance scores, both OTUs were selected. The rings around the tree comprise a heat map in which the inner rings represent the samples of tolerized mice and the outer rings represent those of allergen-sensitized mice. The color saturation indicates the degree of difference from the mean value of the sham-treated samples, where dark blue indicates a ratio of 0 (least abundant), white indicates a ratio of 1.0 (equivalent abundance), and dark red indicates a ratio of 17 (most abundant).

