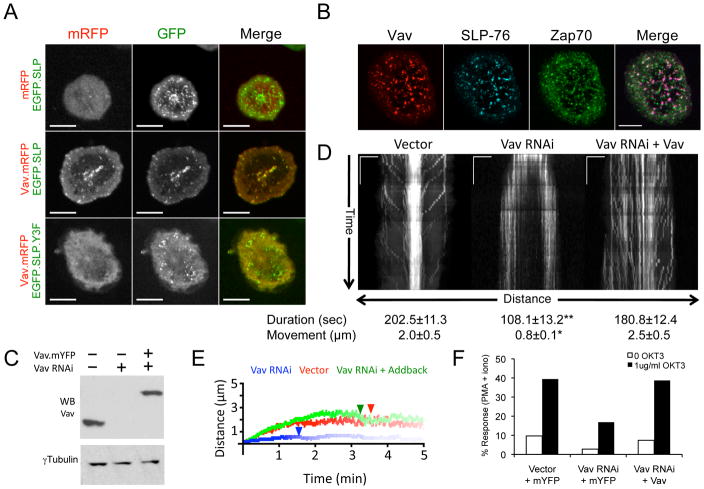
Figure 1. Vav1 enters SLP-76 microclusters and controls their persistence and movement.
(A) J14 cells stably expressing either EGFP-tagged WT or Y3F SLP-76 chimeras (green) were transiently transfected with either mRFP or Vav1.mRFP (red). Still images of cells expressing matched levels of Vav1 were acquired by confocal microscopy 5 minutes after stimulation on anti-TCR coated coverslips. (B) J14 cells stably reconstituted with SLP-76.mYFP (J14.SY) were transiently transfected with Vav1.mCFP and stimulated as in A. The cells were fixed and stained for ZAP70 pY319. Images in A and B are representative of 3 experiments; scale bars correspond to 10μm. (C–F) J14.SY cells were transfected with an empty vector control, a Vav1-specific shRNA expression vector, or the Vav1-targeting vector in conjunction with an shRNA-resistant Vav1.mCFP expression vector. (C) Total lysates were western blotted as indicated. (D) Vav sufficient, deficient, and reconstituted J14.SY cells were stimulated as in A and imaged continuously for 5 minutes. Representative kymographs depicting the directional movement of SLP-76 MC (x-axis) over time (y-axis) are shown. Scale bars represent 5μm x 60 seconds. Mean microcluster duration and movement were determined on a per cell basis by manually tracing MC paths in kymographs and are shown ± SEM (n=10 cells). Single and double asterisks indicate significant differences (p < 0.05 and p < 0.005, respectively) from the vector control. (E) Mean MC traces for each cell were averaged to yield composite kymographs depicting both MC movement (y-axis) and fractional persistence (line intensity) over time (x-axis). See Supplemental Table 1 for further analysis. (F) Vav1 sufficient, deficient, and reconstituted J14.SY cells were assayed for NF-AT activation. One of 4 representative experiments is shown.

