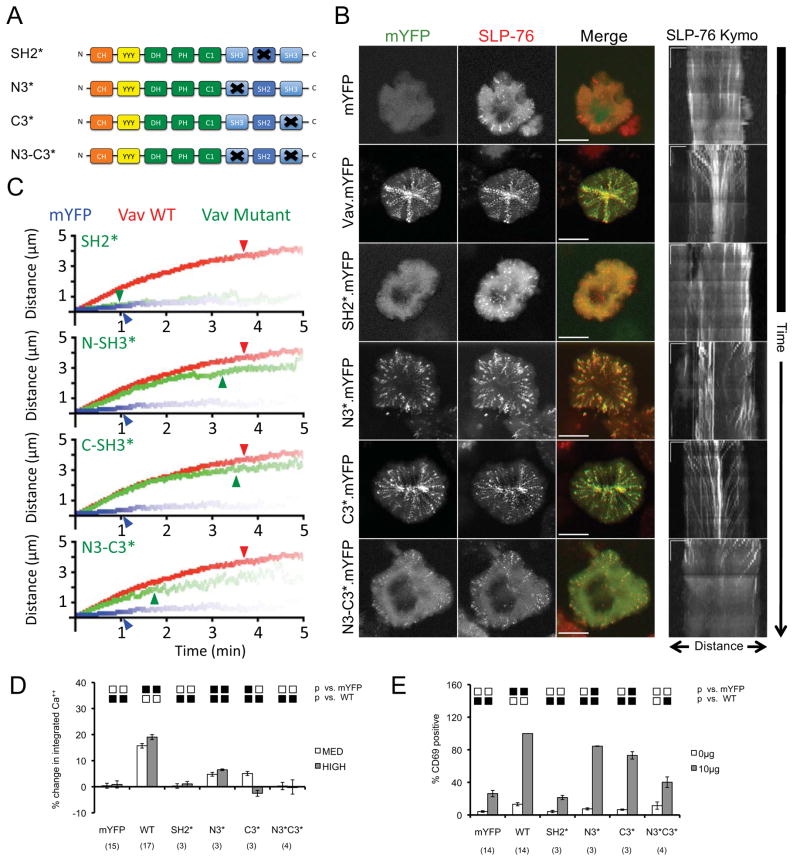
Figure 2. The Src homology domains of Vav1 play distinct roles in microcluster entry, microcluster stabilization, and Vav1 function.
(A) The domain structure of Vav1 mutants used in this figure. (B) Left - J.Vav1 cells stably expressing SLP-76.mCFP (JV.SC cells) were transiently transfected with the indicated Vav1.mYFP constructs and continuously imaged on stimulatory coverslips for 5 minutes. One representative ‘maximum over time’ (MOT) image selected from 3 independent experiments is shown. Scale bars correspond to 10 μm. Right – Kymographs were generated as in Figure 1D; scale bars correspond to 5μm x 60 seconds. (C) Composite kymographs depicting SLP-76 MC movement and persistence were generated as in Figure 1E, using JV.SC cells transfected with mYFP (blue), WT Vav1 (red), or the indicated mutant (green). Arrowheads correspond to the half-life of SLP-76 MC for each condition. See Table 1 for further analysis. (D) TCR-induced intracellular calcium flux was measured in J.Vav1 cells transiently transfected with the indicated Vav1 mutants fused to mYFP. The percent change in the integrated calcium responses of moderate- and high-expressing populations is shown ± SEM, calculated relative to the calcium response of untransfected, mYFP-null cells in the same sample. The number of replicates is shown in parentheses. Significant differences (p < 0.05) from the indicated conditions are denoted by black boxes, unless dominant negative (below the mYFP response, red boxes) or supra-physiological (above the WT response, green boxes). Trends (0.05 < p < 0.10) are denoted similarly by gray, orange, and yellow boxes. (E) J.Vav1 cells were transiently transfected with the indicated Vav1 constructs fused to mYFP and stained for CD69. The fraction of cells expressing CD69 within a tightly gated population expressing moderate levels of mYFP was normalized to the response observed in Vav1.WT-reconstituted cells and is shown ± SEM. Replicates and significant differences are shown as above.

