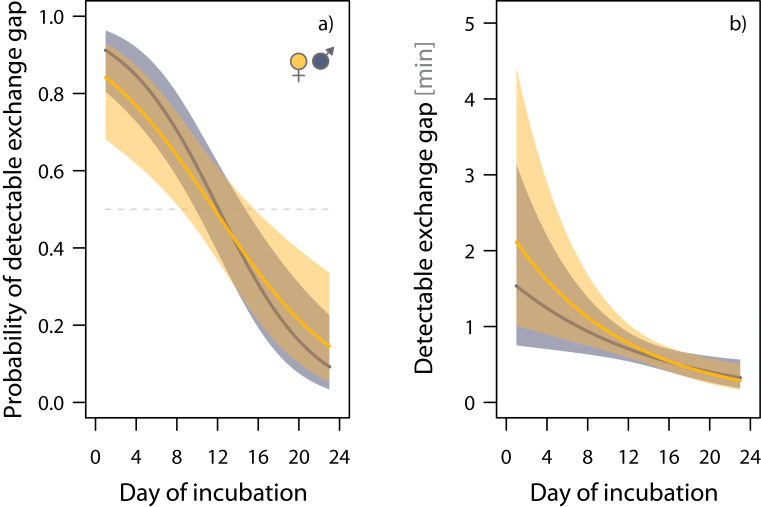
Figure 5.
Decrease in (a) the probability of a detectable exchange gap (≥5 s) and (b) the length of detectable exchange gaps over the incubation period. The solid lines represent the model fit, the shading represents the 95% CI, and the horizontal dashed line in (a) represents the equal probability. Model results are presented in Tables 4 and 5, and the distribution of the raw data is depicted in Supplementary Figure S6.

