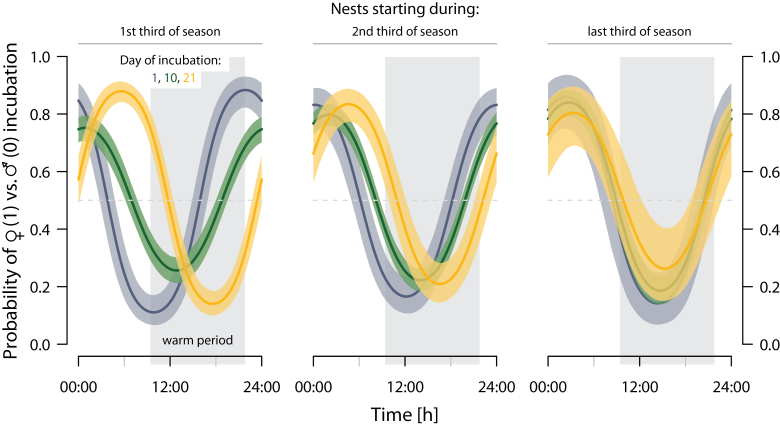
Figure 6.
Shift in the probability of female (vs. male) incubation during specific time of a day over the 21-day incubation period and with respect to the start of incubation within the season. Color lines represent the mean predicted probability of 5000 GLMMs for the 1st (dark blue), the 10th (green), and the 21st (yellow) day of incubation; color shadings represent the nonparametric CIs that contain 95% of the 5000 fits. Left panel: predictions from 6 June (first nest started on 1 June); middle panel: 13 June; right panel: 19 June. The distribution of the nests across the season is in Supplementary Figure S7. The horizontal dashed line indicates an equal share of incubation, and the gray shaded rectangle represents the time when the tundra temperatures were on average above overall median tundra temperature, that is, the warmer period of the Arctic day. Nest-specific incubation patterns for all 48 nests are in Supplementary Actograms.

