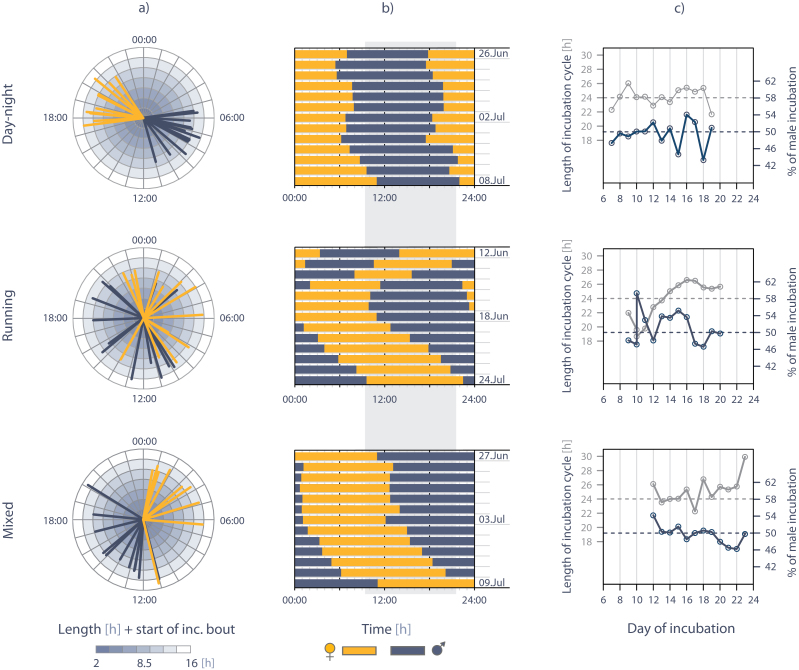
Figure 7.
Examples illustrating the variation in the division of amount and timing of incubation in semipalmated sandpiper pairs. Each row represents 1 specific nest, illustrating a day–night pattern, a running pattern, and a mixed pattern (see text for details). (a) Division of incubation within a day (yellow lines = female, dark blue lines = male; the position of each line marks the start of an incubation bout, the length of the line reflects incubation bout length). (b) Visualization of incubation bouts of females and males across the incubation period (gray shading = approximate warmer period of the day, i.e., the time when the tundra temperatures were on average above median tundra temperature). (c) Changes in the length of the incubation cycle (i.e., the sum of the female and subsequent male bout length; solid gray line, left y axis) and male share of incubation (i.e., the percentage of male incubation within each cycle; solid dark blue line, right y axis) across the incubation period. The dashed lines indicate a 24-h cycle (gray, left y axis) and equal share of incubation (dark blue, right y axis). For illustration, the early or late incubation period is excluded, such that all 3 nests show the same part of the incubation period.

