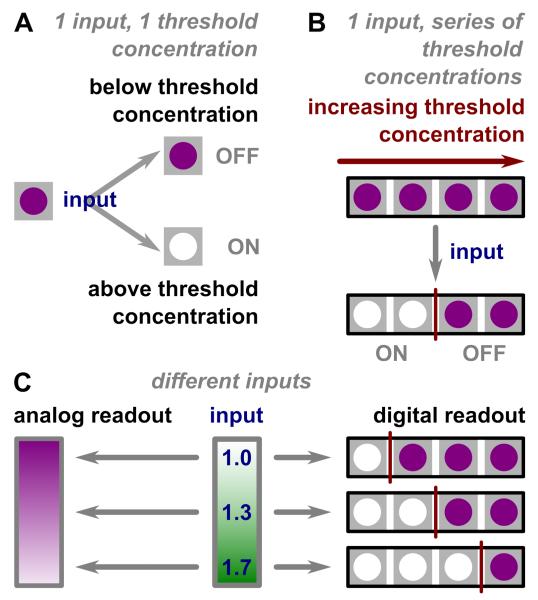
Figure 1.
Illustration of analog-to-digital conversion. A) A depiction of ON/OFF bits. If the input concentration is higher than the threshold concentration, the threshold chemistry gives an ON readout, shown as the color change from purple to white. If the input concentration is lower than the threshold concentration, the color remains purple, or OFF. B) An illustration of a series of ON/OFF bits. An input, when subjected to a series of increasing threshold concentrations, gives a series of ON/OFF responses, with the point of transition (red) between these ON and OFF states depending on the input concentration. C) An illustration of analog readout versus digital readout. An analog readout gives a gradient change in color intensity depending on input concentration (blue lettering). A digital readout comprises a series of bits; each bit is either clear (ON) or intensely colored (OFF), and the series of bits changes as the input concentration changes.

