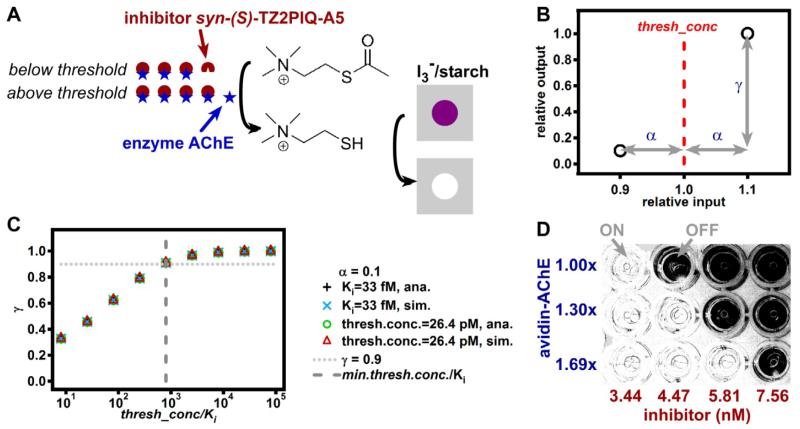
Figure 2.
Threshold chemistry achieved by competitive inhibition. A) A schematic drawing of the threshold chemistry and detection reactions. When the concentration of the enzyme acetylcholinesterase (AChE) exceeds that of the inhibitor (syn-(S)-TZ2PIQ-A522), the enzyme hydrolyzes acetylthiocholine to give thiocholine, which reduces the purple suspension of I3−/starch complex and results in a clear mixture. B) Graphical definition of the parameters α and γ (Equation 1). C) A plot comparing γ values calculated from different thresh_conc/Ki via analytical calculations (ana.) and numerical simulations (sim.) with γ = 0.9 at min_thresh_conc/Ki = 801 as predicted by Equation 2. D) A photograph showing detection of 1.30-fold increases in enzyme concentration with multiple threshold concentrations and visual readout in a 96-well plate. Details of image handling can be found in the Supporting Information.

