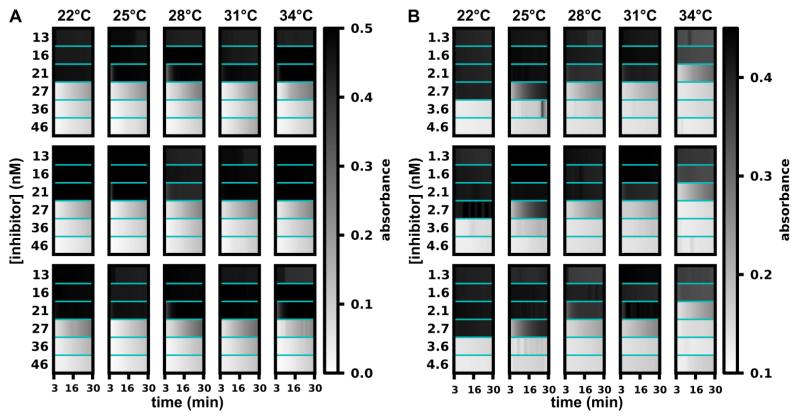
Figure 3.
Robustness of threshold chemistry at different temperatures and readout times. A) False-color maps depict 90 time traces of absorbance from 90 threshold reactions of acetylcholinesterase with a chromogenic substrate (see text for details) as the inhibitor concentrations were changed in a series of 1.3× dilutions (13, 16, 21, 27, 36, and 46 nM) across a 12-degree range of temperatures (22 °C, 25 °C, 28 °C, 31 °C, and 34 °C). B) False-color maps depict 90 time traces of absorbance from 90 threshold reactions of acetylcholinesterase with a chromogenic substrate as the inhibitor concentrations were arranged in a series of 1.3× dilutions (1.3, 1.6, 2.1, 2.7, 3.6, and 4.6 nM; 10 times less [enzyme] and [inhibitor] compared to A) across a 12-degree range of temperatures. Experiment repeats are arranged in rows. Note that in this figure, higher absorbance (dark) is equivalent to higher enzymatic activity, which is opposite from the visual readout system used in other experiments.

