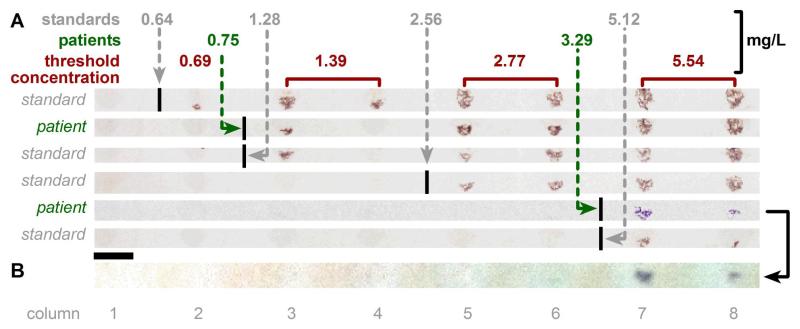
Figure 7.
Results from standard solutions and clinical serum samples over a wide dynamic range. A) Photographs of results, with each row corresponding to one assay (one SlipChip device). B) Photograph of the result of the 3.29 mg/L patient sample recorded with an iPhone 4 camera. Only the first 8 columns of the device described in Figure 5 are shown in Figure 7. The sequence of inhibitor concentrations was set up as in Figure 6A, but with larger steps in concentration (0, 9.4, 19, 38, 75, 150, and 300 nM). Columns 3–4, 5–6, 7–8, 9–10, and 11–12 were set up as duplicates such that each pair contained the same inhibitor concentration. Scale bar: 2 mm. Details of image handling are included in the Supporting Information.

