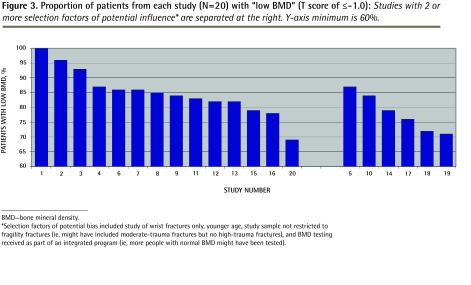
Figure 3.

Proportion of patients from each study (N=20) with “low BMD” (T score of ≤ −1.0): Studies with 2 or more selection factors of potential influence* are separated at the right. Y-axis minimum is 60%.
BMD—bone mineral density.
*Selection factors of potential bias included study of wrist fractures only, younger age, study sample not restricted to fragility fractures (ie, might have included moderate-trauma fractures but no high-trauma fractures), and BMD testing received as part of an integrated program (ie, more people with normal BMD might have been tested).
