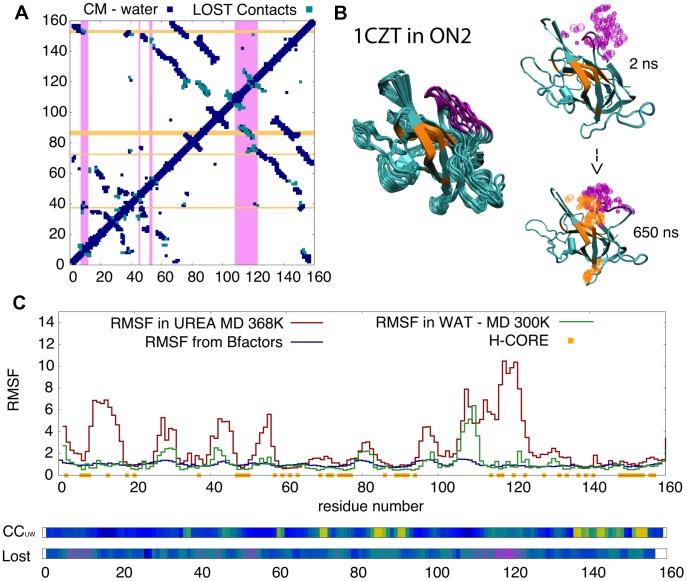
Figure 6. Urea intrusion into the core of 1CZT.
A) Contact map from the crystal structure of 1CZT in blue (each dot represent a contact), the contacts lost during 1 µsec of simulation in urea are shown in light blue. Areas in magenta mark residues with a large flexibility while those in orange mark residues with a high preference to contact urea. B) Snapshots showing the temporal evolution of the protein structure; the areas in magenta and orange follow the same color code as in panel A. Urea molecules within 4 Å of these areas are shown in the same color. Note that flexible areas (in magenta) on the surface of the protein - mainly loops - undergo opening events, and the loss of contacts (panel A) connecting these areas to the protein core (in orange) triggers urea intrusion. C) The residue root mean square fluctuation (RMSF; a measure of flexibility), the contact coefficient CCUW (measure of the binding preference of protein to contact urea rather than water) and the % of lost time (measure of local unfolding) along the protein sequence. These metrics allow us to locate areas with large % of lost contact time and high flexibility in urea (magenta), while orange and yellow regions illustrate large values of CCUW, meaning a remarkable preference to contact urea. For more examples see Suppl. Figure S6-B.

