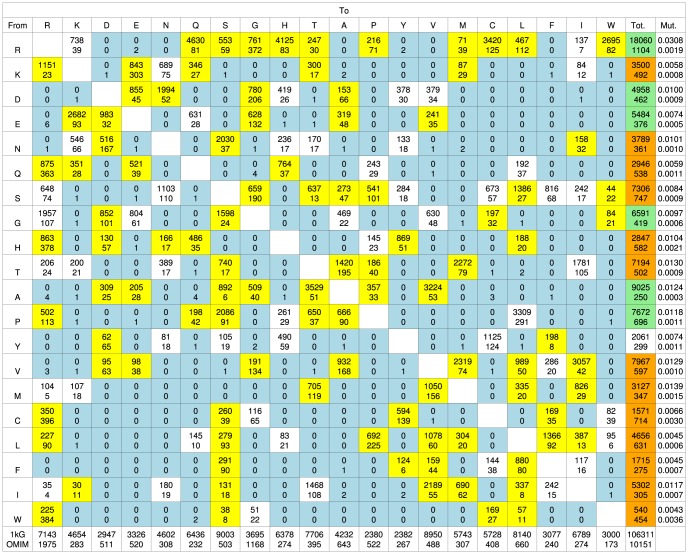
Figure 1. The amino acid exchanges observed in human protein variants.
The 1*. Amino acids are arranged by 1 letter code according to increasing hydrophobicity (least hydrophobic is left and most hydrophobic is right) using the Fauchère and Pliska scale [58]. Yellow blocks indicate mutations where there are statistically significant differences between 1 kG and OMIM. Blue blocks indicate where no mutations were present in the 1 kG data set. White blocks show where there are no statistically significant differences. Green blocks show where there are proportionally more 1 kG mutations compared to OMIM. Orange blocks show where there are proportionally more OMIM mutations than 1 kG. The mutability scores (see methods) for the 1 kG and OMIM sets are shown in the last column. *Note that these matrices are fundamentally different. The 1 kG data set gathers all the observed mutations in the 1 kG project, counting each only once; the OMIM data set combines information gathered from potentially many individuals but filtered to identify those mutations associated with a disease.

