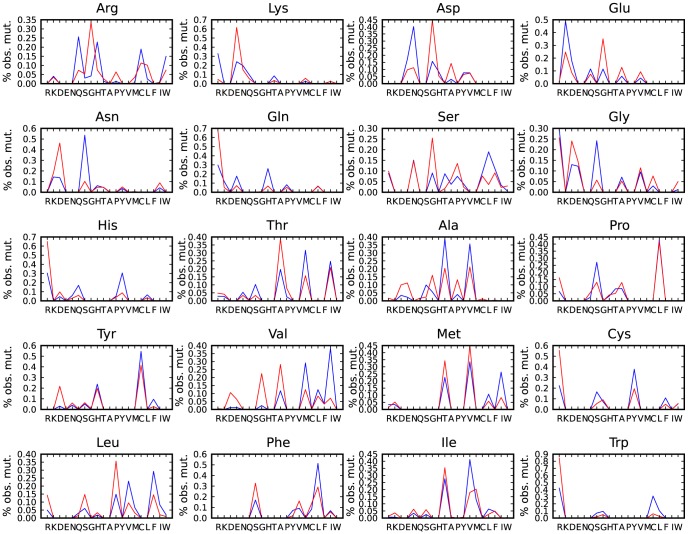
Figure 7. Comparison of the differences in observed mutations in the various sets.
Comparison of the differences in the % of observed mutations in the 1 kG (blue) and OMIM (red) sets for one amino acid mutating to all others e.g. proportionally, more mutations from Lys to Glu are recorded in OMIM than in the 1 kG set. Each plot shows the results of mutation from a specific amino acid (e.g. Arg at top left) to every other amino acid.

