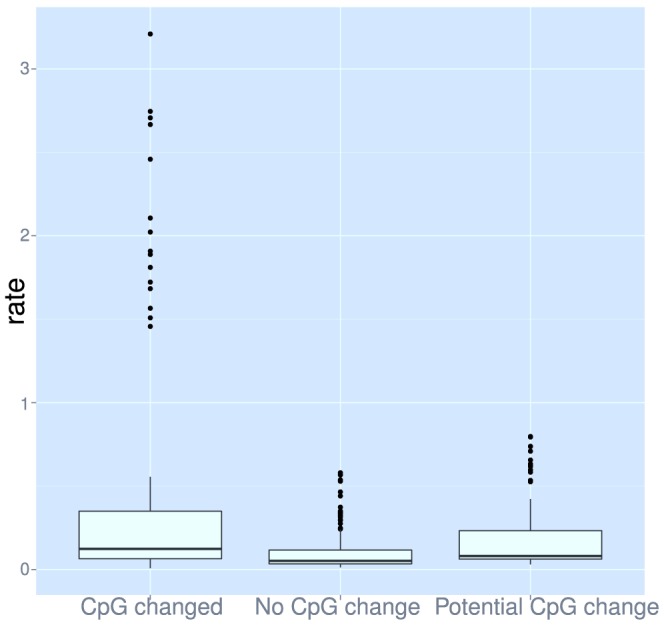
Figure 10. Dependence of mutation rates on the change in CpG status.

Rates of change from codons were calculated similarly to the amino acid rate matrix [36], but on a 61 by 61 codon matrix.

Rates of change from codons were calculated similarly to the amino acid rate matrix [36], but on a 61 by 61 codon matrix.