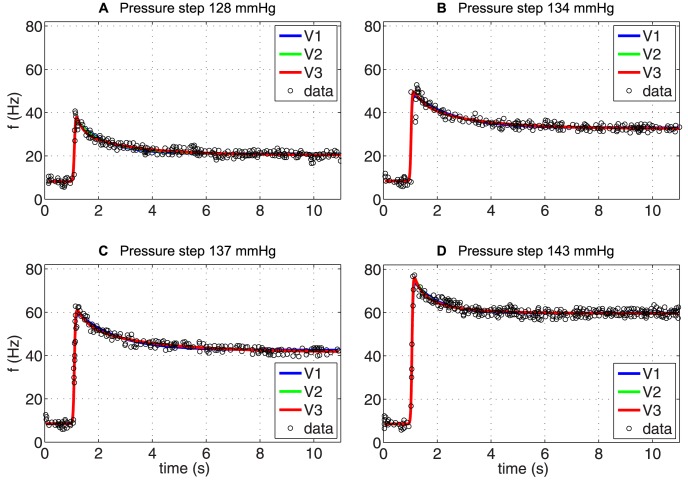
Figure 7. The optimized response of linear BR models.
We show the ability of three linear models  ,
,  and
and  (denoted in the legend as V1, V2, and V3, respectively) to reproduce four types of increases in pressure: ((A) 128 mmHg, (B) 134 mmHg, (C) 137 mmHg, and (D) 143 mmHg) published by Brown [20]. The parameters of each model have been optimized for each data set individually and are listed in Table 4 together with the
  and the RMSE errors.

