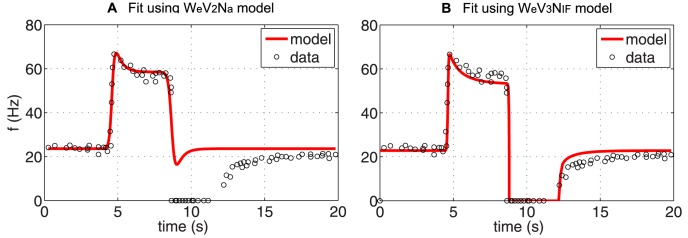
Figure 8. The optimized response of (A)  , and (B)
  to a PED profile of BR firing rate.

The parameters of each model have been optimized for each data set individually and are given in Table 4 together with the  and the RMSE errors.
