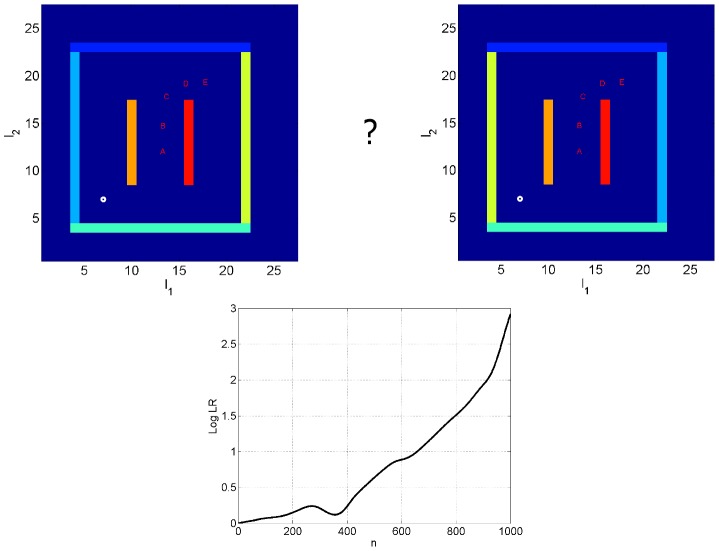
Figure 6. Model selection.
The task of model selection is for the agent to decide which environment it is in (hence the question mark in the above graphic). Top Left: North-east trajectory in maze 2, Top Right: North-east trajectory in maze 1. The mazes have different coloured east and west walls. The markers on the trajectories (A, B, C, D and E) denote locations corresponding to different time points ( and
and  ). Bottom: The log likelihood ratio (of maze 1 versus maze 2),
  , as a function of the number of time points along the trajectory. At n = 1000, the LogLR is approximately 3. This allows the agent to infer, with 95% probability, that it is located in maze 1 rather than maze 2.

