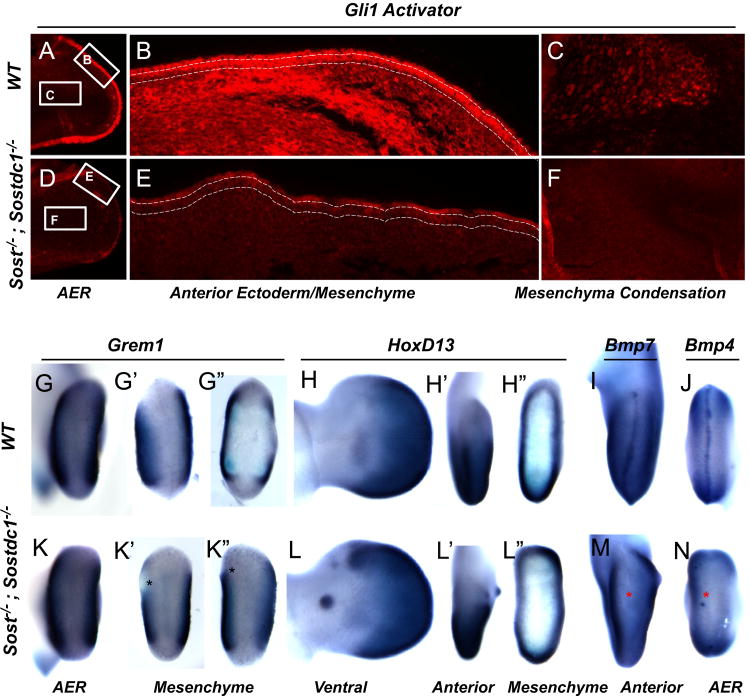
Fig. 7.
Gli3, Grem1, HoxD13, Bmp4 and Bmp7 expression is affected in Sost–/–; Sostdc1–/– E11.5 limbs. Consistent with a reduction in mRNA expression of Gli3, Gli3 activator protein expression was dramatically reduced in the ectoderm of Sost–/–; Sostdc1–/– E11.5 limbs (A and D). Higher magnification images of the anterior region of the limb showed a dramatic reduction in Gli3 both in the ectoderm (marked by dashed lines) and the underlying mesenchyme (B and E). Similarly, the pre-chondrocytes in the cartilage condensation stained positive for Gli3 in the WT limbs, but had little expression in the double knockouts (F). Grem1 expression was reduced in the anterior mesenchyme in double knockout (K′–K″) relative to WT limbs (G′–G″). Asterisks indicate region of lost anterior expression. HoxD13 was ectopically up-regulated in the anterior mesenchyme in the regions corresponding to digit 1 (L, L′, and L″; green arrows) and on the ventral side of the autopod in an ectodermal nubbin (L′ green arrow). Both Bmp4 and Bmp7 expression was absent from the AER (M and N; red asterisks). Views are indicated at the bottom of the figure.

