
FIGURE 3:
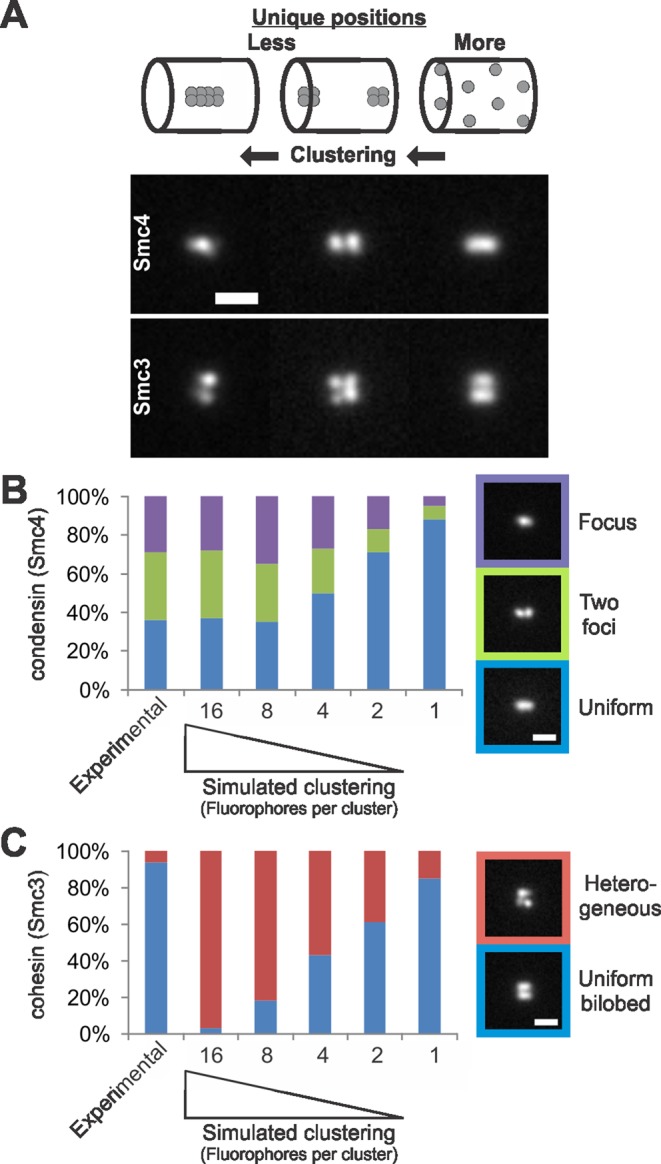
Simulations of clustering increase heterogeneity. (A) Simulations increasing fluorophore clustering (from right to left) in the best-fit condensin (Smc4, top) and cohesin barrels (Smc3, bottom). Labeling fewer positions in the cylinder results in heterogeneous images, whereas allowing each fluorophore to label a unique position produces a homogeneous image. (B and C) Simulations of clustering were performed by placing the measured number of fluorophores (240) into groups of 16, 8, 4, 2, or 1 and allowing them to randomly fill the condensin or cohesin cylinders. The result of clustering is less-unique fluorophore positions are labeled in the cylinder (15, 30, 60, 120, and 240 unique positions labeled, respectively). (B) Experimental Smc4-GFP and condensin cylinder simulations (350-nm outer diameter, 130-nm inner diameter, 700-nm length) were line scanned to determine the percentage of each fluorescence class (i.e., one focus = purple, two foci = green, uniform line = blue). (C) Experimental Smc3-GFP and cohesin cylinder simulations (500-nm central diameter, 50 nm thick, 550-nm length) were line scanned for a bilobed distribution and homogeneous lobes (blue). Images were scored as heterogeneous (red) if images were either not bilobed or did not contain homogeneous lobes. Scale bar: 1 μm.