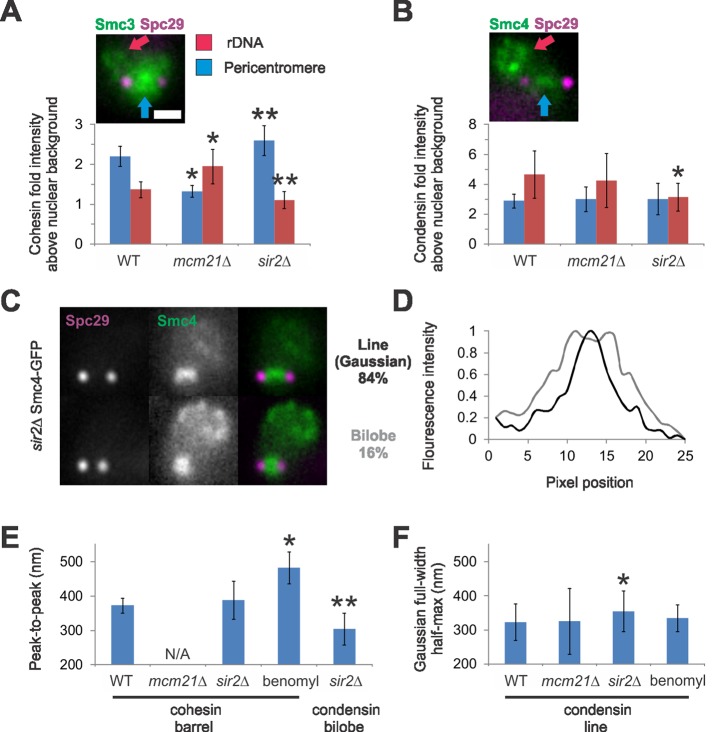
FIGURE 5:
Condensin spindle proximal position is dependent on Sir2. (A and B) Example images show Smc3/4-GFP pericentromere enrichment between the spindles poles (Spc29, purple) as well as enrichment in the rDNA loop in the nucleolus. Graphs of (A) cohesin and (B) condensin fold intensity over nuclear background (normalized to 1.0) for the pericentromere (blue) and rDNA (red) in WT, mcm21Δ, and sir2Δ. (C) Examples of pericentric condensin (Smc4-GFP) in sir2Δ cells as a line (84%, black) or bilobed (16%, gray; n = 65). (D) Line scans perpendicular to the spindle axis of the example images shown in (C). (E) Graph of sagittal peak-to-peak inclusive measurements for cohesin WT, sir2Δ (389 nm, n = 12), cells treated with low benomyl (10–20 μg/ml for 45 min; 483 nm; Haase et al., 2012), and sir2Δ condensin bilobes (305 nm, n = 10). (F) Graph of Gaussian FWHM measures for condensin lines (mcm21Δ: n = 15; sir2Δ: n = 40; low benomyl: n = 17). Asterisk denotes significant difference from WT (p < 0.01). Mutants with a different number of asterisks denote statistical difference from each other (p < 0.01). Scale bar: 1 μm.

