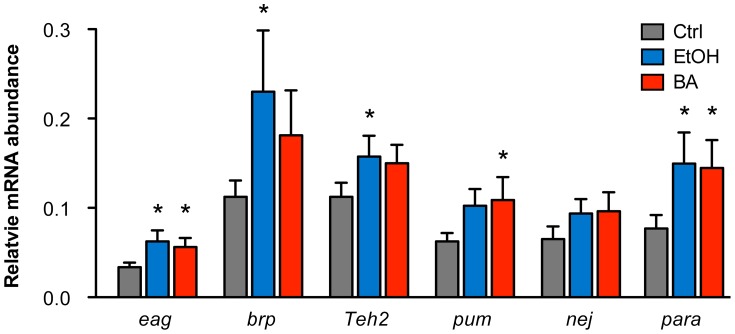
Figure 4. Alcohol-induced upregulation of expression of candidate genes.
The relative mRNA levels for candidate genes eag, brp, Teh2, pum, nej, and para in control animals, benzyl alcohol-sedated animals, and ethanol-sedated animals are shown. Abundance of mRNA for each gene was determined by quantitative reverse-transcription PCR analysis and expressed relative to the abundance of the Cyp1 gene. Error bars are SEM. Asterisks denote statistically significant differences from the untreated controls (P<0.05, One-way ANOVA with Dunnett's post-hoc test). Overall statistical significance of the effects of alcohol treatment for the whole set of genes was determined by Two-way ANOVA (P = 0.013).

