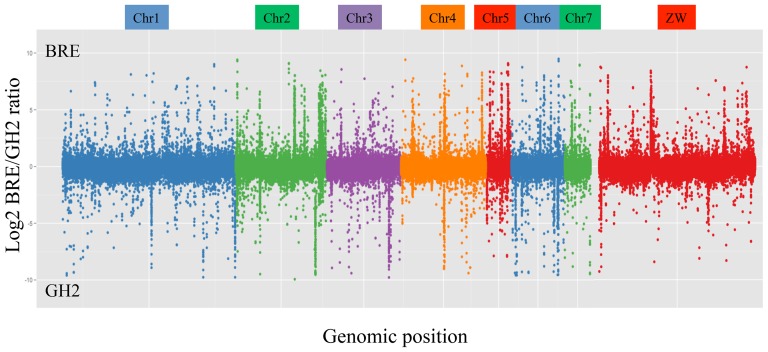
Figure 1. Log 2 ratio plot of copy number variations (BRE/GH2) along the Schistosoma mansoni genome.
The x-axis represents the genome position in basepairs. Chromosomes are colour coded. The y-axis shows log2 ratio between BRE and GH2. Positive values indicate overrepresentation of a region in BRE, negative values indicate overrepresentation of a region in GH2.

