
Figure 5. Phenotype-based cluster analysis of wMel variants.
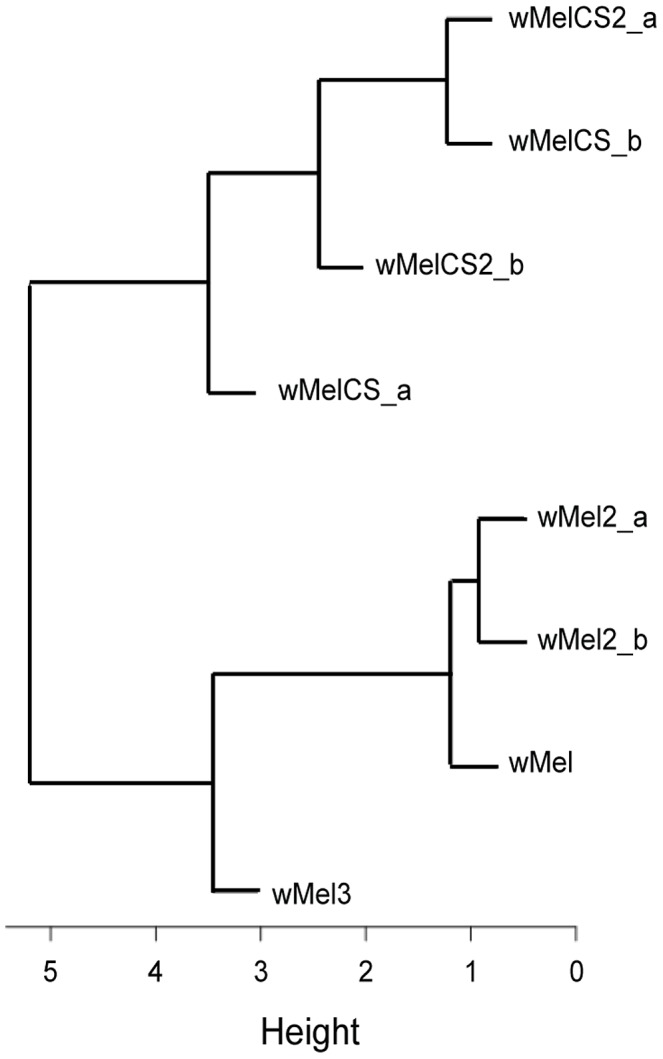
Cluster diagram of the wMel variants based on the Euclidian distance of the scaled values of Cox hazard ratios of long-term survival, survival to FVH and DCV infections, FHV and DCV titres upon infection, and Wolbachia titres (Data in Table S2).