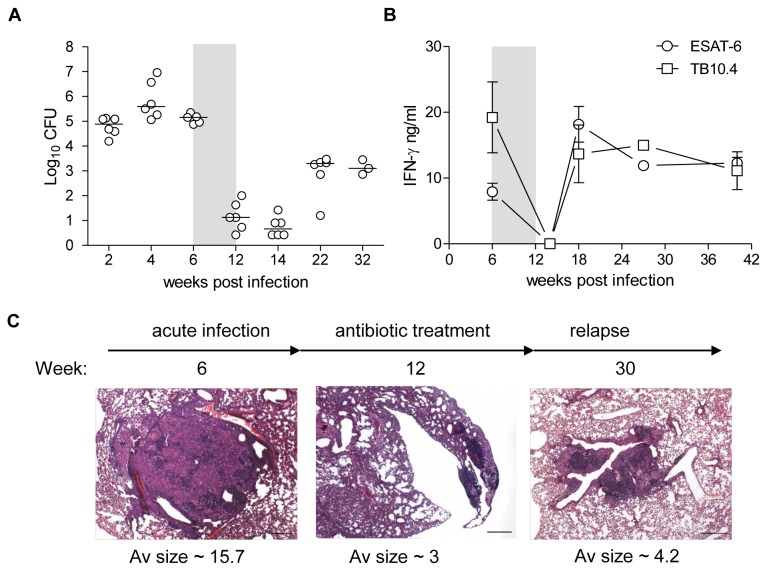
Figure 1. Mouse model of latent TB and relapse.
(A) Groups of BALB/c x C57BL/6 (CB6F1) mice were infected by aerosol route with approximately 50 CFU of M.tb. Erdman. At week 6 post infection (p.i.) mice were given antibiotics in the drinking water ad libitum for six weeks (grey area) and allowed to spontaneously resume growth. Five-six mice (week 32 p.i. n=3) were sacrificed at various time-points during infection and lungs were harvested for determination of bacterial load during primary infection (week 0-6 p.i.), antibiotic treatment/latent phase (week 6-14 p.i.) and during the relapse phase (week 22-32 p.i.) and are expressed as log10 CFU. Data are shown as scatter dot plot and medians are displayed as a horizontal line for each time-point. (B) Lymphocytes were isolated at various time-points from perfused lungs and re-stimulated with ESAT-6 (open circles) and TB10.4 (open squares). Antigen-specific IFN-γ response was measured by ELISA. Data are shown as mean ± SEM of three independent experiments except for week 14 and 27 which are from one experiment. (C) Photomicrographs illustrating typical ‘acute’/primary infection (week 6 p.i.), antibiotic treatment/latent (week 12) and relapse (week 30 p.i.) phase lesions after aerosol infection with M.tb. Haematoxylin and eosin stain. Scale bar = 250 μm.

