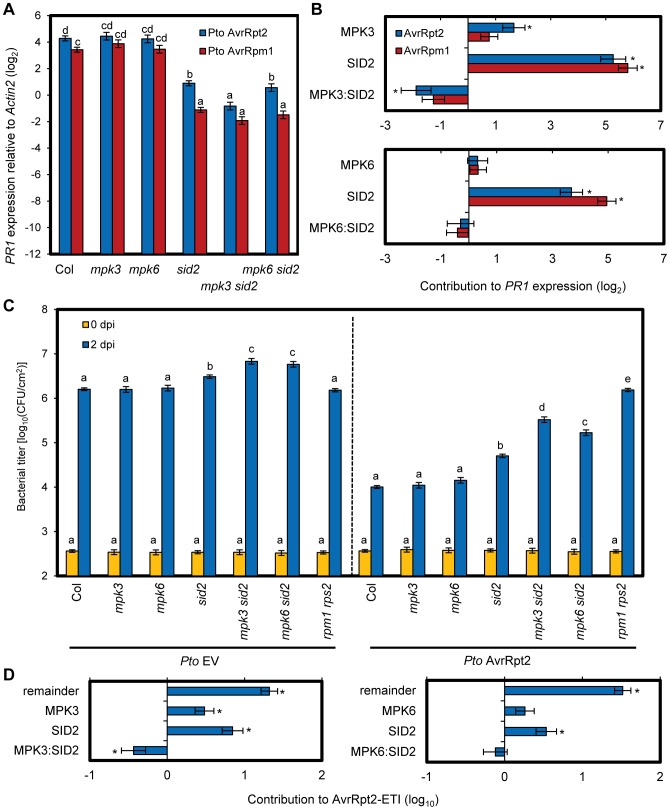
Figure 7. Compensation between MPK3 and SA contributes to the robust ETI levels.
(A) The PR1 expression level in leaves of the indicated genotypes at 24 hpi with Pto AvrRpt2 (blue bars) or AvrRpm1 (red bars) (OD600 = 0.001) was determined by qRT-PCR. Bars represent means and standard errors of three biological replicates calculated using a mixed linear model. The vertical axis shows the log2 expression level relative to Actin2 (At2g18780). Statistically significant differences are indicated by different letters (P<0.01, two-tailed t-tests). (B) The signaling allocations for the PR1 expression level shown in (A) were estimated for MPK3 and SID2 (upper panel) or MPK6 and SID2 (lower panel). (C) The bacterial counts of Pto EV (left panel) or AvrRpt2 (right panel) (inoculation dose, OD600 = 0.0001) at 0 or 2 dpi in leaves of the indicated genotypes were measured. Bars represent means and standard errors of three independent experiments with at least 4 or 12 biological replicates for 0 dpi or 2 dpi, respectively. Statistically significant differences are indicated by different letters per strain per dpi (P<0.01, two-tailed t-tests). (D) The signaling allocations for AvrRpt2-ETI shown in (C, 2 dpi) were estimated for MPK3 and SID2 (left panel) or MPK6 and SID2 (right panel). (B,D) Bars represent means and standard errors determined using a mixed linear model. Asterisks indicate significant effects or interaction (P<0.01).

