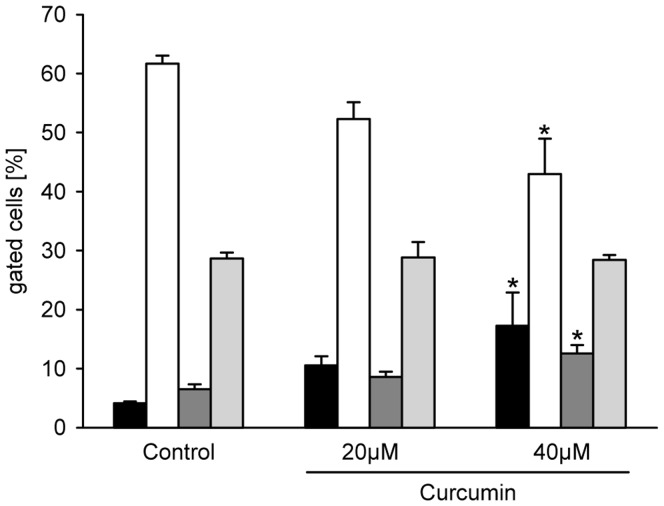
Figure 7. Cell cycle analysis of curcumin-treated B78H1 cells.
Gated cells [%] in G1 phase (white bars), S phase (dark grey bars), G2 phase (light grey bars) and apoptosis (black bars), as measured by flow cytometry. The cultured cells were treated with 20 µM and 40 µM curcumin or vehicle (0.1% DMSO) for 48 h. Means ± SEM. *P<0.05 vs. control.

