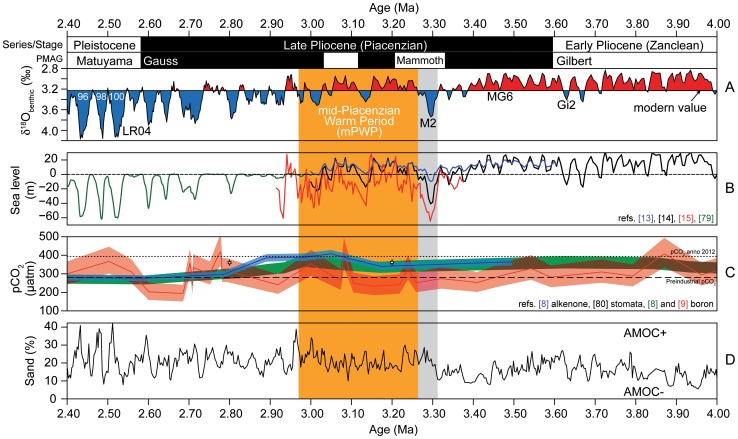
Figure 1. Marine isotope stage M2 in the long-term climate evolution of the Pliocene.
(A) Time scale, including palaeomagnetic reversals (PMAG) and the LR04 benthic isotope stack [10], orange shading shows mid-Piacenzian Warm Period ( = mid-Pliocene Warm Period), grey shading shows marine isotope stage MIS M2; (B) sea level estimates for the Pliocene to Pleistocene [13]–[15], [79]; (C) Late Pliocene atmospheric carbon dioxide concentrations based on boron, alkenones and leaf stomata [8], [9], [80]; (D) long-term carbonate-sand record at ODP Site 999 as an indicator for Pacific water flow through the Central American Seaway into the Atlantic and AMOC [27].

