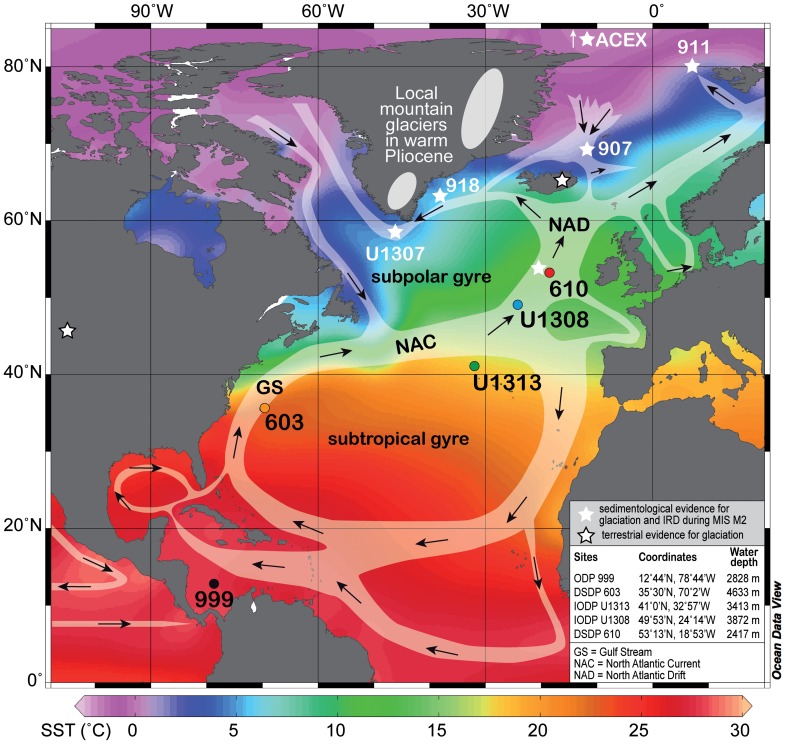
Figure 2. Modern North Atlantic surface circulation with modern sea surface temperatures (World Ocean Atlas 2005 [81]).
Each studied site is indicated by the same colour in subsequent figures, and other sites discussed in the text are shown in white. Ice caps on Greenland are schematic representations of Pliocene reconstructions [4].

