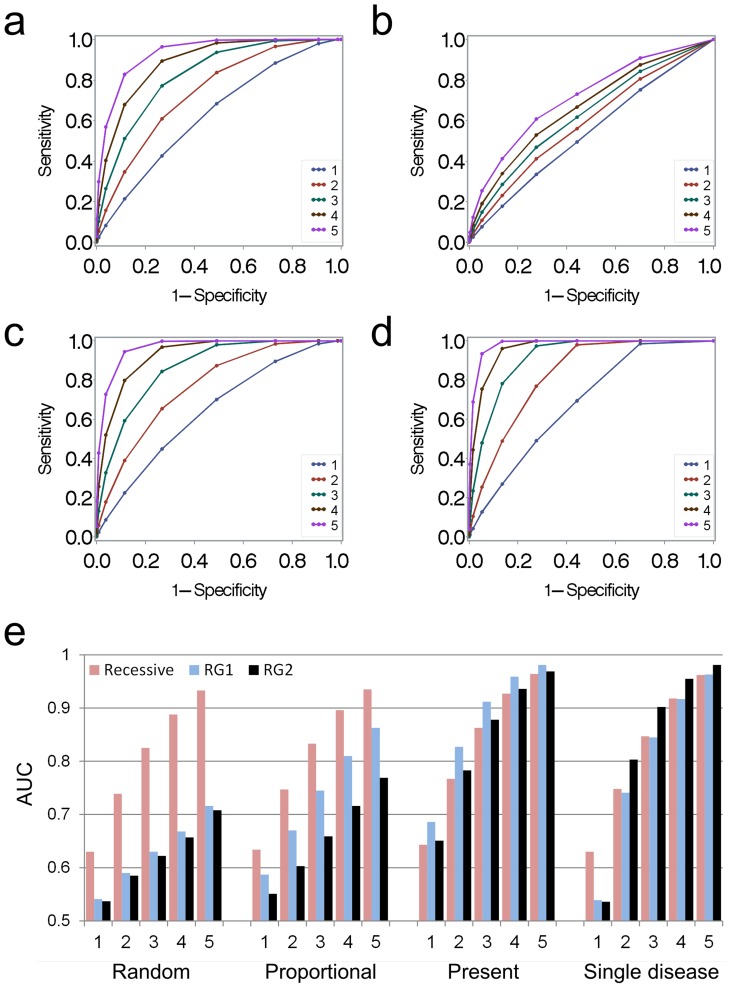
Figure 2. ROC analyses for simulation studies.
Analyses are based on 10,000 random samples of 13 phenotyped subjects drawn from the thrombosis data set. ROC curves show sensitivity and specificities based on association p-values when one to five subjects were assigned to be affected with a constituent disease, as compared to association p-values associated with no additional cases. Panels (a) and (b) show ROC curves based on p-value associations for the recessive and reverse genetics models (with >2 affected subjects per constituent phenotype), respectively, when five subjects were assigned a random constituent disease. Each line corresponds to the number of additional subjects assigned a disease. Panels (c) and (d) represent the same models, respectively, for subjects assigned a disease already present among the 13 subjects in the random sample. Panel (e) summarizes AUC values from ROC curves for the recessive, reverse genetics with >2 affected subject (RG1) and reverse genetics with >2 affected and p<0.1 (RG2) models under the four simulations conditions tested. The number of the x-axis refers to the number of additional subjects assigned an affection status for each simulation scenario.

