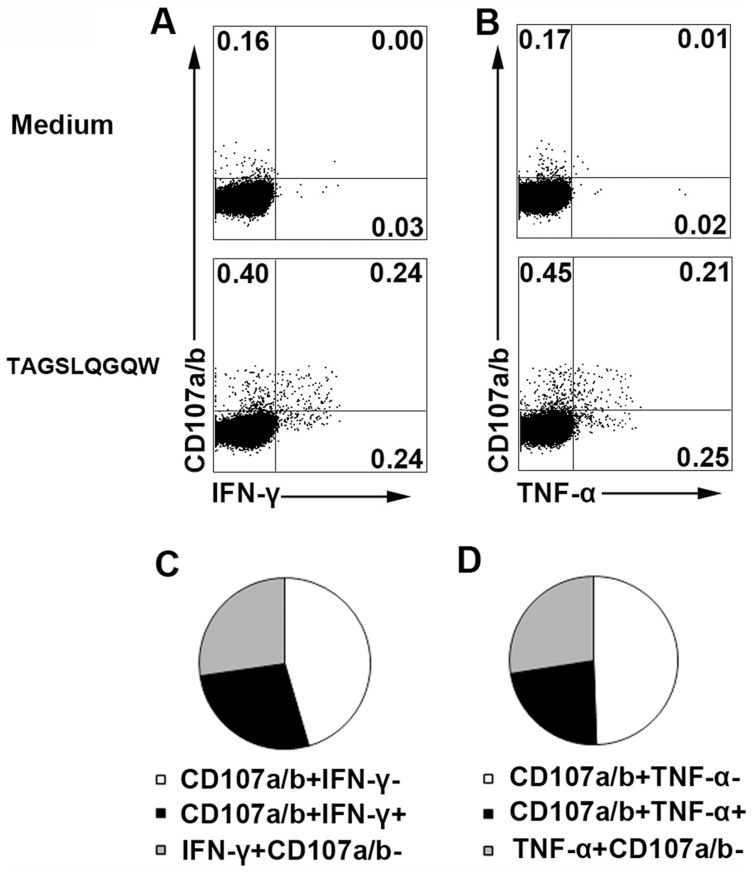
Figure 8. Coexpression of CD107a/b and IFN-γ or TNF-α in CD8+ T cells following stimulation with 9aa CFP10 peptide.
PFCs were stimulated with or without TAGSLQGQW (CFP1035–43) in the presence of anti-CD107a/b mAbs for 8 h. (A, B) The expression of CD107a/b, IFN-γ (A) and TNF-α (B) by CD8+ T cells was assessed by flow cytometry. Numbers in quadrants indicate percentages of the cells in each population. (C, D) Coexpression of CD107a/b and IFN-γ (C) or TNF-α (D) by CD8+ T cells was shown. The data were quantified and presented in a pie chart, in which each slice of the pie represents the fraction of the median frequencies of a given quadrant. Data shown are representative of three independent experiments with similar results.

