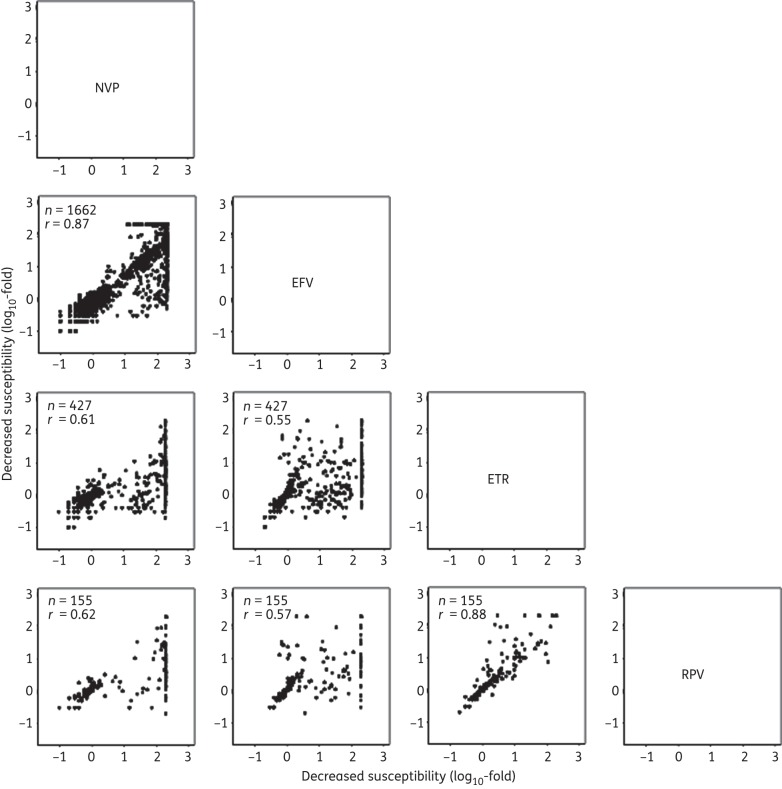
Figure 1.
Correlations between the log10-fold reductions in susceptibility of each isolate for each pair of NNRTIs. The x-axis indicates the log10-fold susceptibility reduction of the NNRTI shown above the plots, and the y-axis indicates the log10-fold susceptibility reduction of the NNRTI to the right of the plots. The number of isolates (n) for which phenotype results were available and the correlation coefficient (r) are contained within each plot. NVP, nevirapine; EFV, efavirenz; ETR, etravirine; RPV, rilpivirine.

