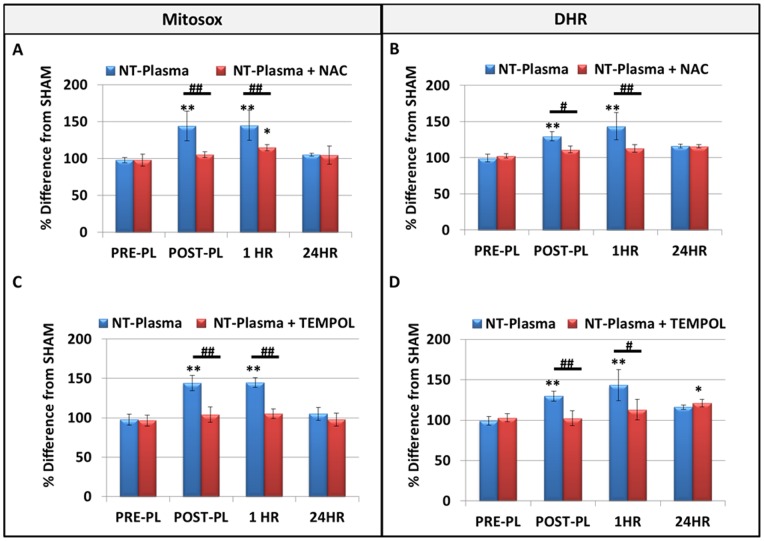
Figure 2. Direct effects of NT-plasma on intracellular ROS production.
(A and B) Intracellular O2 −. and H2O2 levels were measured using fluorescent indicators MitoSox (n = 3) and dihydrorhodamine (DHR), (n = 3) respectively. Immediately post-treatment (POST-PL) and at 1 hr, 1000 Hz NT-plasma treated cells generated significantly increased amounts of O2 −. and H2O2 (p<0.001) as compared to sham control or pre-treatment levels (PRE-PL). Amounts of both ROS were decreased by 24 hr. NAC and TEMPOL quenched the ROS increase POST-PL and at 1 hr (p<0.01–0.001). However, H2O2 levels in the TEMPOL (p<0.01) inhibitor group were significantly increased above control at 24 hr, presumably due to removal of baseline NO. The results are expressed as the mean ± standard deviation. Statistical significance was determined by the Mann-Whitney U test for non-parametric data; * or # (p<0.01) ** or ## (p<0.001.

