Figure 2.

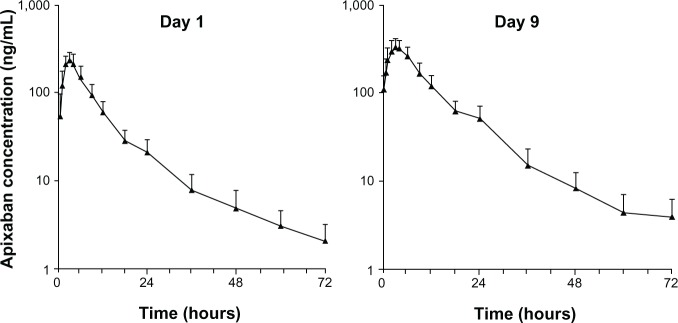
Mean plasma apixaban concentration versus time (n=12) following single-dose administration (day 1) and at steady state (day 9). Error bars show +1 standard deviation from the mean.

Mean plasma apixaban concentration versus time (n=12) following single-dose administration (day 1) and at steady state (day 9). Error bars show +1 standard deviation from the mean.