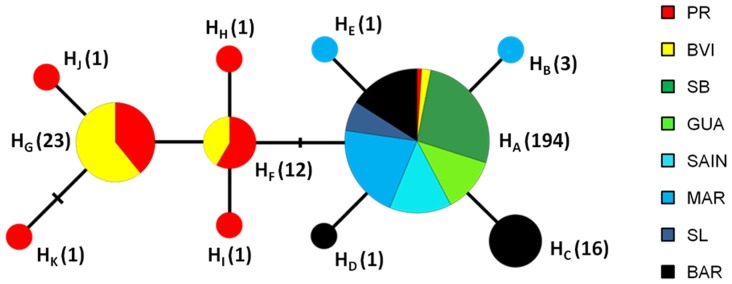
Figure 2. Minimum spanning network of 11 haplotypes (HA–HK) for 627 bp mtDNA COI sequences.
Each circle represent a haplotype and the circle area is roughly proportional to the number of individuals sharing this haplotype (number of individuals harbouring a given haplotype is written in parenthesis, right to the haplotype name. Segments linking haplotypes are proportional to nucleotidic differences between haplotypes (one segment corresponding to one nucleotidic difference). Colours and its surface within a circle refer to the eight sampled islands and the relative abundance of a given haplotype, respectively. See Figure 1 for island acronyms.

