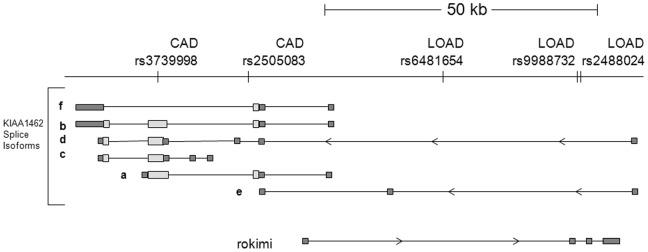
Figure 4. CAD and LOAD associated SNPs mapped to intron/exon map of expressed genes.

SNPs associated with CAD and LOAD are shown on the top line. Isoforms of KIAA1462 and “rokimi” are shown in relation underneath. Direction of transcription is symbolized by arrows. Exons are shown as boxes, and introns as lines. Putative protein coding regions of exons are shown as lighter colored boxes, and noncoding regions as darker boxes.
