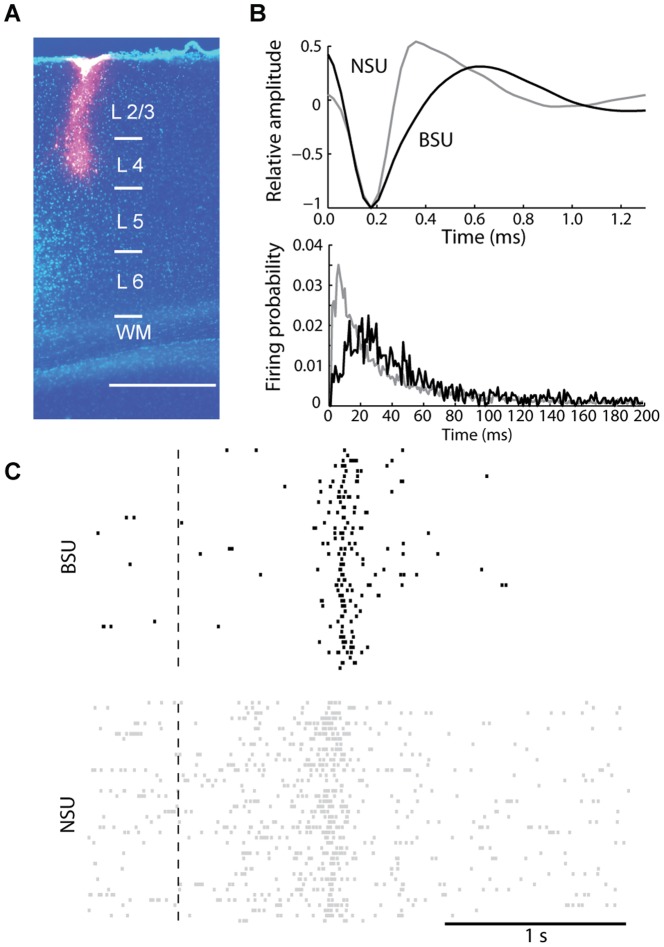
Figure 6. A BSU and a NSU isolated with spike sorting from multiunit recordings in layer 4.
A. Nissl counterstained coronal section in a rat recorded with an electrode coated with DiI (red) consisting of 4 horizontally aligned tetrodes located at the tip (point of maximal penetration). Bar. 600 µm. B. Example of an extracellularly isolated BSU (black) and NSU (gray). Top plot: mean AP waveforms; bottom plot: interspike interval distributions. Both plots were obtained taking into account only APs occurring in absence of visual stimulation. Note the narrower AP shape of the NSU and that the interspike interval distribution of the NSU is skewed towards shorter values. C. Examples of raster plots recorded from a BSU (top, black) and a NSU (bottom, gray) when visual stimulation was presented. Dashed line indicates the motion onset of the light bar on the screen. Note the higher spontaneous activity for the NSU compared to the BSU.

