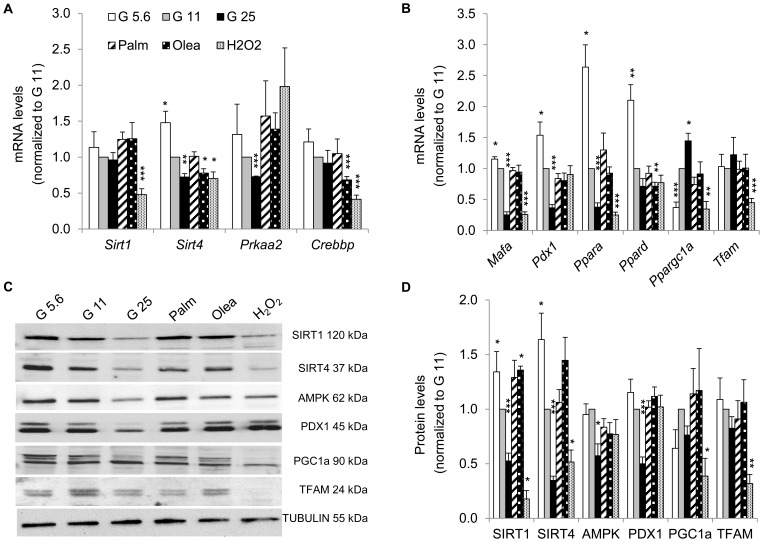
Figure 3. Expression of key energy sensors and transcription factors in INS-1E cells after stress exposure.
Transcript levels of (A) redox state-related genes (the sirtuins Sirt1 and Sirt4), the catalytic subunit of AMPK encoded by Prkaa2 gene, the cAMP-responsive acetylase CREB binding protein Crebbp and (B) transcription factors were quantified as described for figure 2D. Results are means ± SEM of 2 independent experiments done in triplicate. (C) Representative immunoblotting showing levels of the energy sensors SIRT1, SIRT4, AMPK, PGC1α and the transcription factors PDX1 and TFAM from INS-1E cells under different experimental conditions. (D) Quantitative analysis of relative band densities normalized to TUBULIN as shown in (C) is presented as means ± SEM of at least 4 independent experiments. Results are expressed as protein levels normalized to G11 values. *P<0.05, **P<0.01, ***P<0.005 versus G11 controls.

