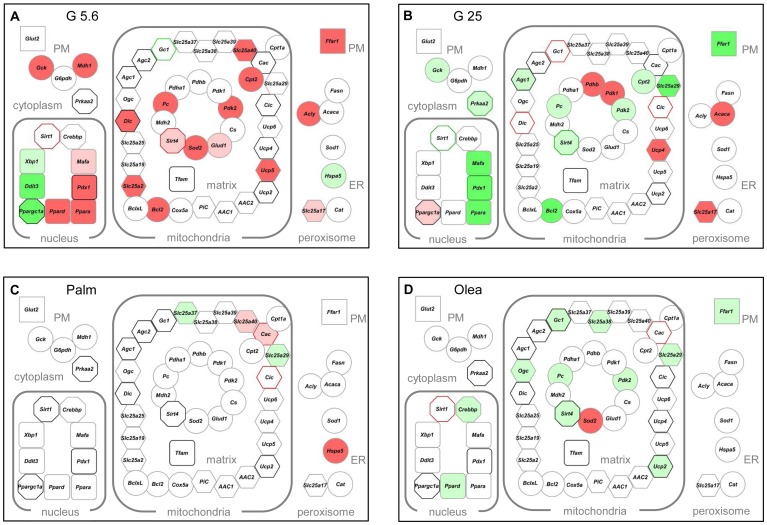
Figure 8. Transcriptome and proteome from INS-1E cells cultured 3 days under different stress conditions.
The schemes provide a global view of the expression of the 60 genes at transcript (node core) and protein (node border) levels: (A) low glucose (G5.6) (B) high glucose (G25) (C) palmitate (Palm) (D) oleate (Olea). The expressed genes were grouped using the Cytoscape software according to their protein subcellular localization (from the databases UniProtKB/SwissProt and neXtProt); plasma membrane (PM), cytoplasm, nucleus, mitochondrial inner membrane, matrix, endoplasmic reticulum (ER), and peroxisome. Node shape: rectangles represent transporters or receptors, circles are enzymes or stress proteins, octagons show energy related sensors, round rectangles transcription factors, and hexagons carriers. Colors reflect changes in expression levels versus G11 controls: green and red for significant (P<0.05) down- and upregulation, respectively. Dark green: levels <0.5; light green: levels >0.5 but <0.8; pink: levels >1.2 but <1.5; red: levels >1.5. Border colors: black no change in protein level; grey not tested.

