
Figure 4.
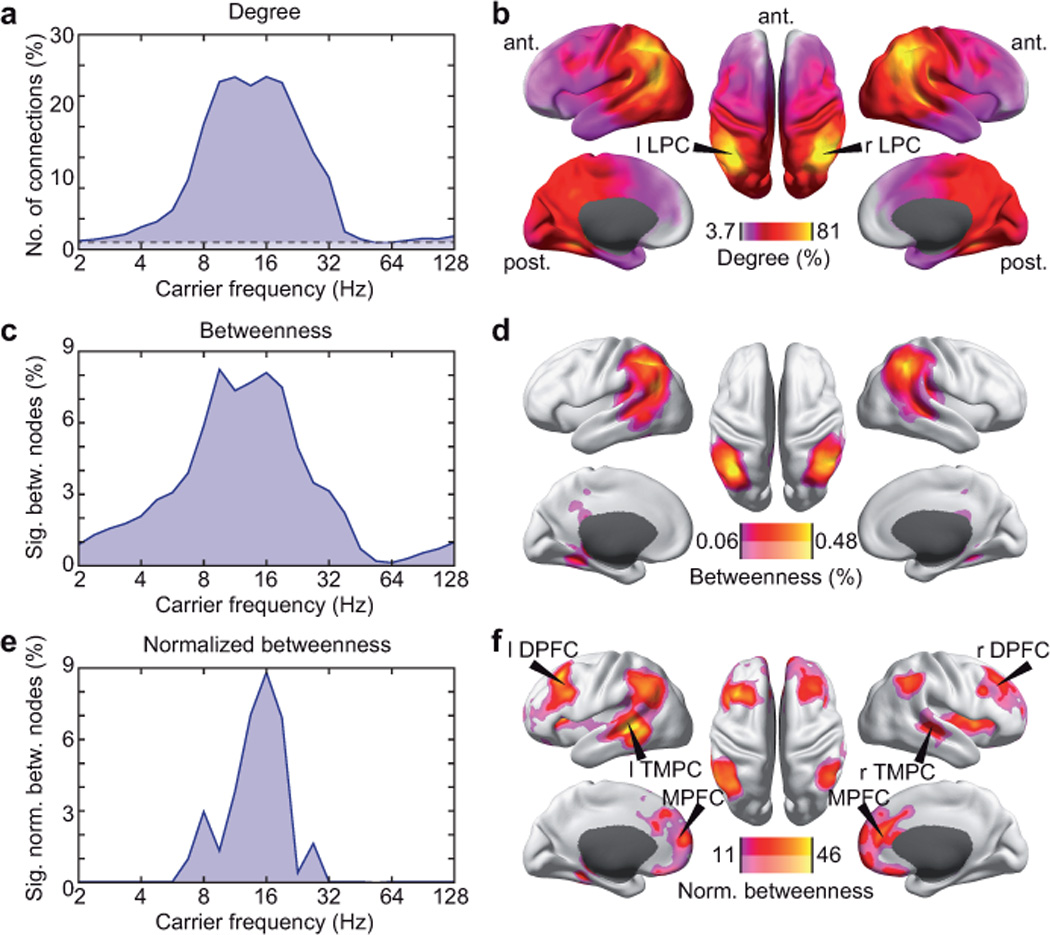
Graph-theoretical analysis of the global correlation structure of band-limited neuronal signals. (a) Spectrally resolved degree. The dashed line indicates the significance threshold (1.01%; P = 0.05, corrected for the number of nodes). (b) Degree at a carrier frequency of 16 Hz resolved in cortical space (LPC, lateral parietal cortex). The color scale is adjusted to the maximal and minimal degree occurring. (c) Spectrally resolved number of nodes with significantly increased betweenness compared to the average betweenness value (voxel-wise permutation test for betweenness > average betweenness, corrected for the number of nodes, P < 0.05). (d) Betweenness at a carrier frequency of 16 Hz resolved in cortical space. Betweenness is statistically masked at two levels (permutation test, corrected for the number of nodes, P < 0.05, saturated color scale; permutation test, P < 0.05, uncorrected, desaturated color scale). The color scale is adjusted to the maximal and minimal betweenness within the statistical mask. (e) Spectrally resolved number of normalized betweenness nodes defined analogously to c. (f) Normalized betweenness at a carrier frequency of 16 Hz resolved in cortical space defined analogously to d (MPFC, medial prefrontal cortex; TMPC, temporal cortex; DPFC, dorsal prefrontal cortex).