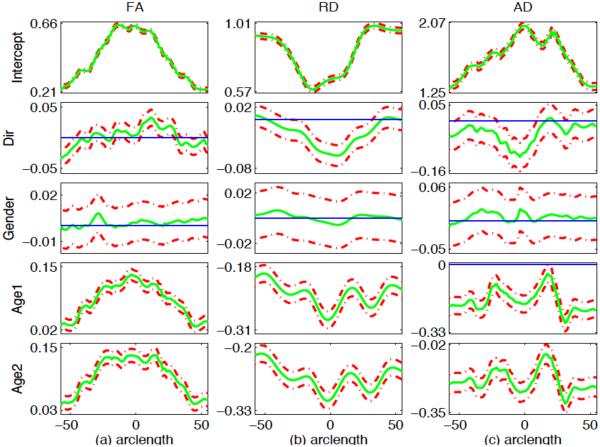
Fig. 11.
95% simultaneous confidence bands for varying coefficient functions for FA (a), RD (b) and AD (c) along the splenium of the corpus callosum tract. The solid curves are the estimated coefficient functions, and the dashed curves are the 95% confidence bands. The thin horizontal line is the line crossing the origin.

