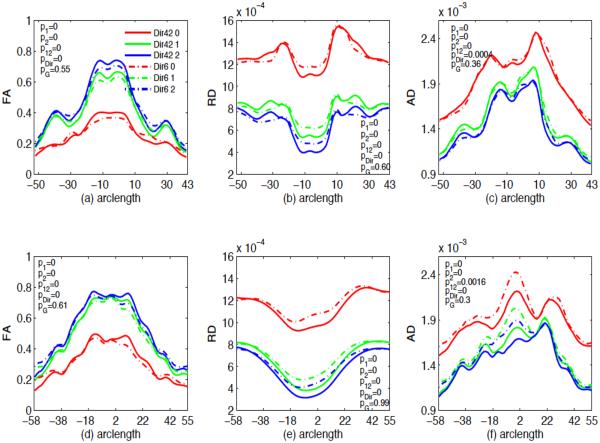
Fig. 9.
Mean FA, RD and AD values along the genu ((a), (b) and (c)) and splenium ((d), (e) and (f)) of the corpus callosum tract and gender, number of gradient directions and age effects on FA, RD and AD values. Solid lines are mean FA, RD and AD curves for the 42 gradient directions while the dashed lines are mean curves for the 6 gradient directions. Red for neonate, green for the first year age, and blue for the second year age. p1 is the p value for the difference in the diffusion measure between neonate and the first year, p2 is the p value for the difference in the diffusion measure between neonate and the second year, p12 is the p value for the difference between the first year and the second year, pG is the p value for the gender effect, pDir is the p value for the effect of the number of gradient directions.

