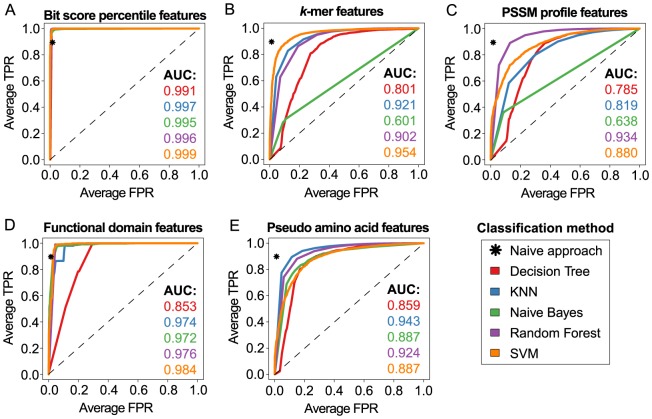
Figure 3. Evaluation of classifiers and feature types for TF/non-TF discrimination.
(A) Each of the shown curves corresponds to one of five supervised machine learning methods trained on our novel bit score percentile features, which were employed to distinguish TFs from other proteins. The individual curves obtained for each of the four cross-validation folds were averaged based on the class discrimination cutoffs. Averaged ROC curves were computed in an analogous manner for (B) k-mer features, (C) PSSM profile features, (D) functional domain features and (E) pseudo amino acid features. The sensitivity and specificity achieved by the naive BLAST-based approach correspond to a single point in ROC space marked by an asterisk.

