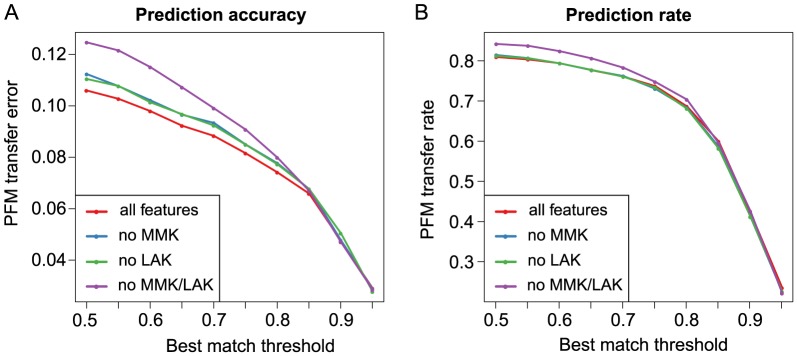
Figure 6. Evaluation of different features for DNA motif prediction.

(A) The deviation between the predicted and annotated DNA motifs (i.e., PFM transfer error) was assessed based on the average [0, 1]-distance  (see Methods section) by 4-fold stratified cross-validation. The curves indicate the average PFM transfer error observed for different features depending on the minimum PFM similarity (i.e., best match threshold) predicted for the training set TFs, whose PFMs were merged to generate the predicted PFM. (B) The relative frequency with which a DNA motif could be predicted for a given TF (i.e., PFM transfer rate) was concurrently determined for varying best match thresholds. The shown curves correspond to the PFM transfer rate observed for different features, which were incorporated into the SVR models used for PFM similarity estimation.
