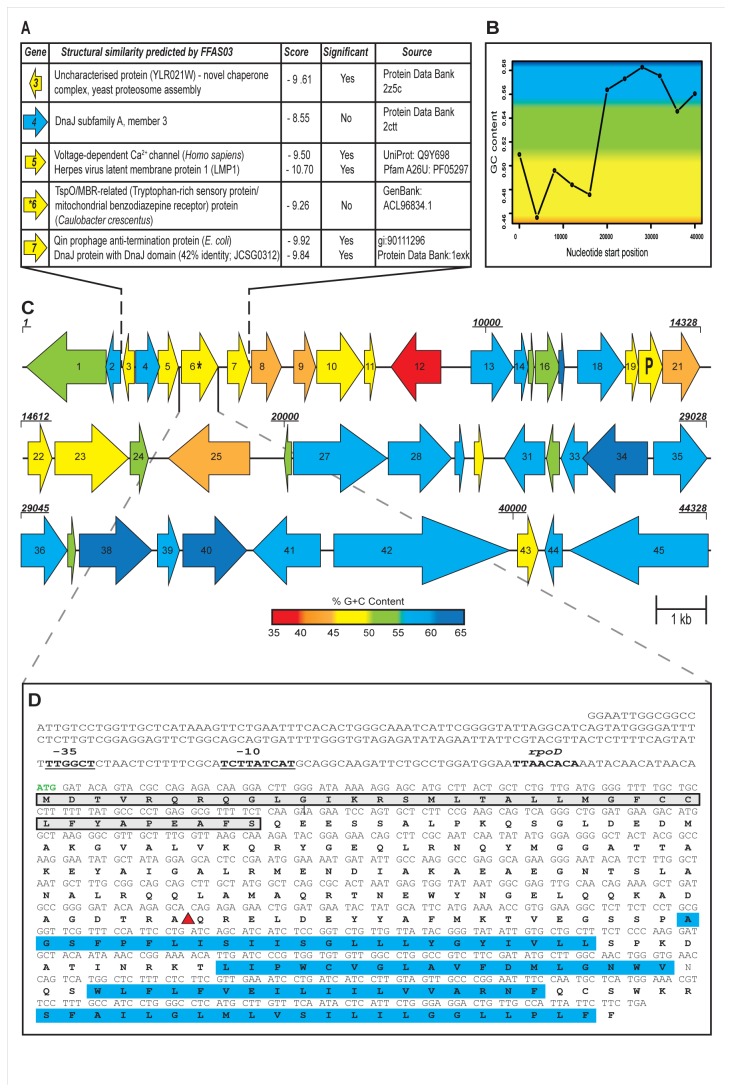
Figure 2. Bioinformatic analysis of SMG 25 fosmid insert.
(A) FFAS03 analysis of the StlA protein and the encoded proteins of flanking genes was performed to identify putative distant structural homologues. A score of -9.50 or lower is considered significant. (B) Representation of the G+C skew of the entire fosmid insert of SMG 25. (C) Representation of the gene arrangement on SMG 25. Gene lengths are approximately to scale and colour coding represents G+C content of each individual gene which can be determined from the G+C content gradient bar. The presence of a phage-associated gene and clear separation in G+C content over the length of the fosmid insert indicates much of this region may have been acquired via lateral gene transfer (LGT). Phage-associated gene is marked “P”, while the stlA gene is indicated with an asterisk (*) symbol. Genes are numbered as indicated in Table 1 and as mentioned in the text. Numbering of some shorter genes has been excluded for clarity. Selected nucleotide positions (in base pairs) are displayed in bold italic font above genes. (D) A detailed view is presented of the nucleotide and amino acid sequence of the stlA gene and StlA protein respectively. The putative start codon is in green, while a 250 base-pair region upstream of this is shown to include putative -35 and -10 promoter regions (underlined) and a predicted rpoD transcription factor binding site (in bold). Amino acids surrounded by grey box indicate the predicted signal sequence of StlA and those highlighted in blue represent four transmembrane regions. The location of the EZTn5 transposon insertion is indicated with a red triangle.

