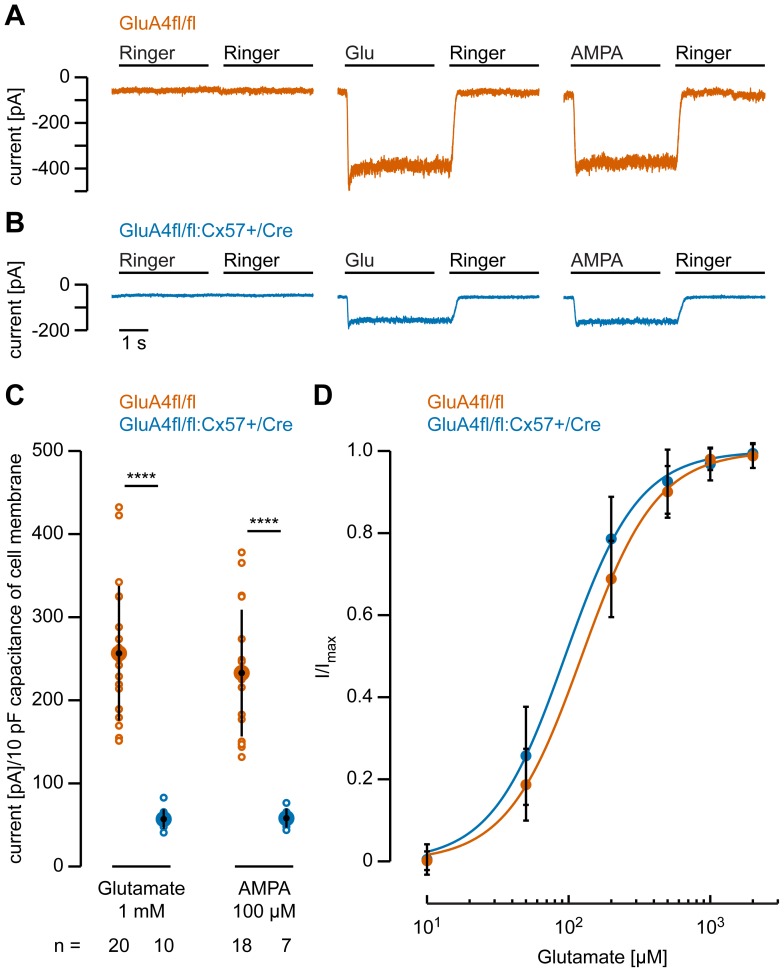
Figure 5. Glutamate- and AMPA-induced currents are reduced in horizontal cells lacking the GluA4 subunit.
A, B, Representative current traces recorded from GluA4-expressing (A) and GluA4-deficient horizontal cell somata (B) at a holding potential of -70 mV. No significant inward current was elicited by Ringer’s solution. However, inward currents were induced by glutamate (Glu, 1 mM) or AMPA application (100 µM). Drug-induced currents were still present but strongly reduced in GluA4-deficient horizontal cells (B). C, Quantification of the glutamate- and AMPA-induced currents in both genotypes. In GluA4-deficient horizontal cells, current amplitudes were significantly reduced by about 75% compared to control cells. Please note that current amplitudes are normalized to 10 pF capacitance of cell membrane to account for differences in cell size. Small circles represent values for individual cells whereas large, black-filled circles represent the means; error bars show SD. n specifies the number of measured cells. D, Dose-response curve for glutamate, measured for both genotypes (GluA4fl/fl: n = 11; GluA4fl/fl:Cx57+/Cre: n = 7). Data were normalized to Imax and fitted to the Hill equation to obtain EC50 values (GluA4fl/fl: 128 ±38 µM; GluA4fl/fl:Cx57+/Cre: 99 ±32 µM) and Hill coefficients (GluA4fl/fl: 1.71 ±0.15; GluA4fl/fl:Cx57+/Cre: 1.81 ±0.57). Differences were not significant (EC50: p = 0.12; Hill: p = 0.56). Values are given as mean ± SD. ****, p < 0.0001.

