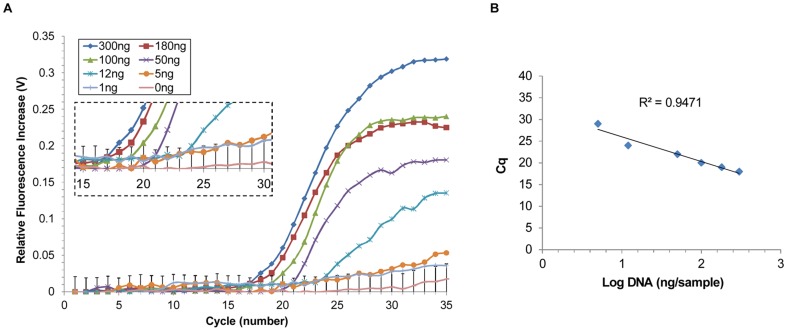
Figure 6. Performance of the portable real-time microchip PCR system using different concentrations of Fv DNA.
(A) Amplication plot of PMT voltage output over the thermocycle number. Using 300, 180, 100, 50, 12, and 5 ng/sample, the Cq was 18, 19, 20, 22, 24, and 29, respectively (enlarged graph shows the Cq). The error bar of the negative control (0 ng) is the standard deviation. (B) Correlation graph of the DNA amount and the Cq (R2>0.947).

