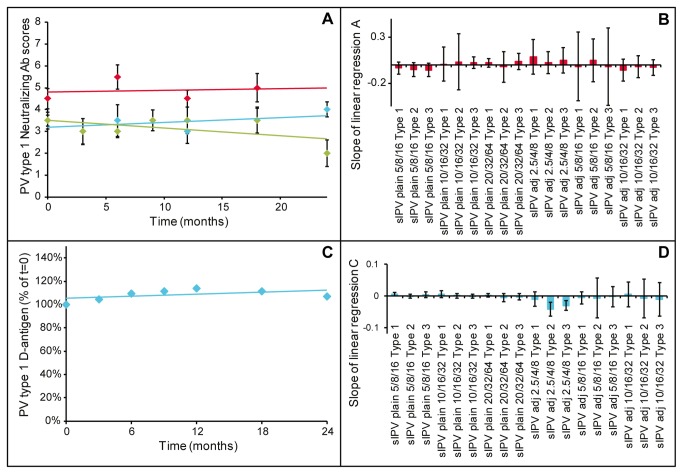
Figure 5. Stability of sIPV.
Panel A: PV type 1 VNT of plain sIPV 20/32/64 (blue), 10/16/32 (red), 5/8/16 (green) in time, error bars depict standard deviation of the median (n=10 rats); Panel B: slopes of linear regression lines determined for stability based on rat immunogenicity as illustrated in panel A, error bars depict 95% confidence interval; Panel C: Stability of PV type 1 D-antigen of sIPV 20/32/64; Panel D: slopes of linear regression lines determined for stability based on D-antigen as illustrated in panel C, error bars depict 95% confidence interval.

